Rather than using traditional art materials for her work, Yoon Han has chosen facts and figures.
“Data has many stories,” she explains. “We can rebuild hidden narratives from big data.”
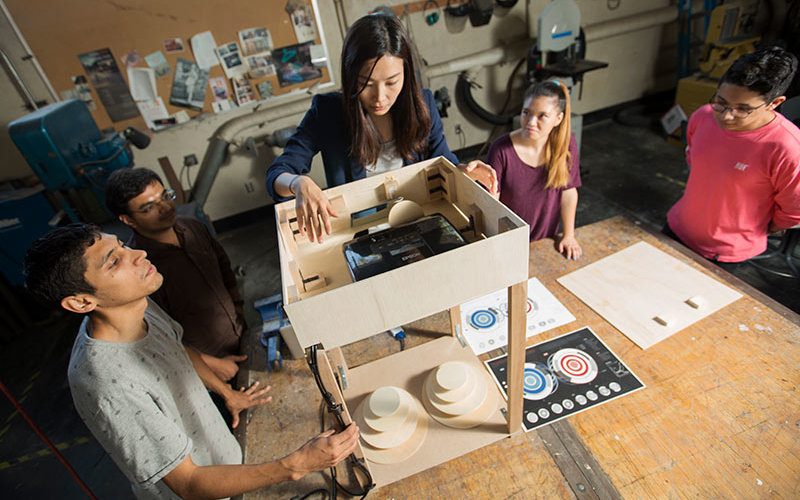
The assistant professor of art has taken a team of students on a journey to find more intuitive and attractive ways to design data, reveal information and, ultimately, learn something meaningful from their analysis. The graphic designer uses different types of media and technology to map and scale numbers into visual elements.
Open-source data of the years-long drought in California became Han’s raw material for “California Drought Impact: Multimodal Data Representation to Predict the Water Cycle,” which used wooden sculptures and projection mapping images with user interactions to analyze drought patterns and encourage environmental stewardship.
Her most recent project, “Causes and Effects — Visualizing Causes and Effects of California Sea Lion Unusual Mortality Event (UME),” analyzes the impact of such environmental changes in California sea lions.
“We use sculptural variations and projections, and there’s interactivity. People can actually participate and change the visuals,” Han explains.
One of the elements of the sea lion mortality project is an interactive website that lets you simulate the effect of the water temperature and sea level on the mammals’ mortality rate. Han hopes to raise awareness to the importance of ongoing environmental changes and their eventual impact on humans.
Danielle Gee, a junior majoring in graphic design, assisted Han with both the drought and the sea lion data projects.
“I had taken a graphic design class taught by Professor Han and was very intrigued by her own work regarding interactive design, as I had never really explored that facet of art before,” says Gee.
For the sea lions project, which Han just presented at the IEEE VIS 2017 Arts Program in Phoenix, Gee helped build a wooden structure for the projector and created a four-layered model — the platform for the sea lion data. With fellow graphic design major Miguel Maya, she’s learning about different techniques in molding, woodworking and setting up an exhibit.
Josh Cuellar, a graphic design major, was charged with the web design of the website, while Praful Surve, who is pursuing a master’s degree in computer science, helped the professor write the software code for data visualization.
“Along with the coding part of the project, I got an opportunity to learn how environmental changes are affecting sea lions and how they are emaciated, dehydrated and underweight for their age,” explains Surve, adding that the project helped him enhance his technical skills.
“This changed my view about how fast the environment is changing and how much care we have to show toward it.”
“Any visual element,” says Han, “can tell you something.”
Both projects will be exhibited through Oct. 21 — “California Drought Impact” at The Packard building as part of PUMP 2017 in Long Beach, and “Causes and Effects” in Long Beach’s Work Evolution Lab.