Mapping Quakes
Geological mapping is drawing the contacts between different rock units on a topographic map. “In this case, we follow the surface rupture and record its trace with GPS,” Akçiz explains. “This will produce a map of the earthquake and will include information on how many faults were involved with the earthquake rupture, how wide the deformation zone was at each fault, and how much displacement of the surface occurred along the fault.”
Why Map
The extent of faulting and magnitudes of surface displacement are essential in understanding the earthquake and the distribution of the aftershocks, Akçiz notes:
“This information might also end up getting used to design structures, including homes and office buildings, to withstand the distributed cracking and expected shaking.”
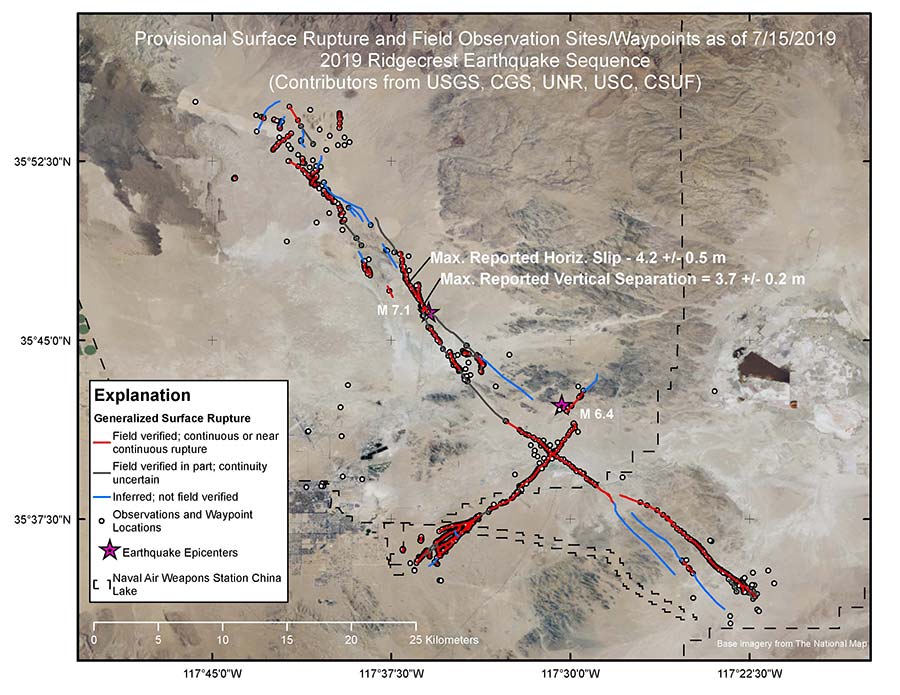
General surface rupture based on field mapping and satellite data as of July 15, 2019. Ruptures from the magnitude 6.4 event trend northeast to southwest, and ruptures from the magnitude 7.1 event trend northwest to southeast. Circles indicate where scientists have visited the fault surface rupture. (Credit: USGS)
What’s at Fault
One interesting observation Akçiz made in the field is that the main fault gets split into two to three faults once it meets the bedrock region. “Generally, faults are more focused within harder bedrock and distributed over areas with unconsolidated sediments. However, in this case, the more resistive bedrock region is where the deformation gets distributed. It is possible that pre-existing faults are responsible for this distribution.”
Akçiz also discovered that the south end of the rupture has a broad split, roughly 1 mile of distributed cracking. As a result, the rupture is distributed over hundreds of cracks that are not easy to map or record in displacement measurements.