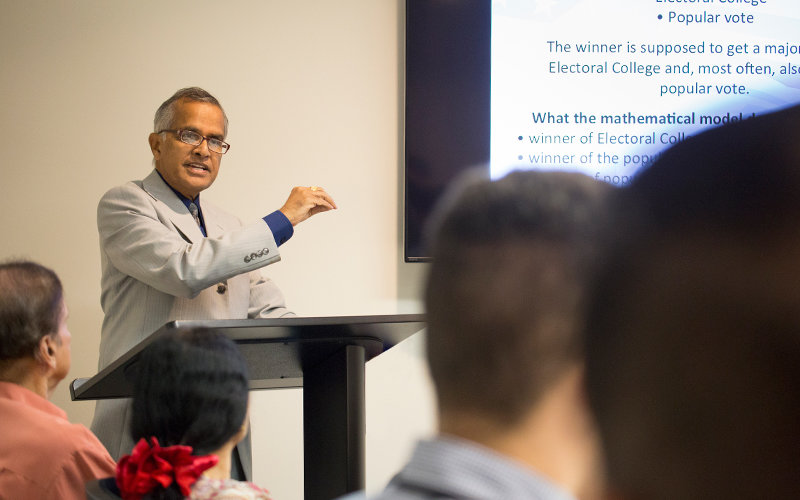
Chandrasekhar Putcha, Cal State Fullerton professor emeritus of civil and environmental engineering, has used math to answer the question on everyone’s minds every four years since 2008: Who will be the next U.S. president?
In the 2024 race for the White House, Putcha’s mathematical model forecasts former President Donald Trump to win with 47.95% of the popular vote and 271 electoral votes, while Vice President Kamala Harris would gain 46.12% of the popular vote and 267 electoral votes — a 2% margin of error. The winning candidate needs 270 electoral votes to win the presidency.
Putcha notes that the presidential race is still fluid one week before the election. National polls show that battleground states remain extremely tight, and neither candidate holds a strong lead in the states that are likely to decide the presidency.
In previous presidential elections, the mathematical model correctly predicted that Joe Biden would win the presidency in 2020, and that Barack Obama would win the presidency in 2008 and 2012. In the 2016 presidential election between Trump and Democratic nominee Hillary Clinton, the model predicted Clinton to win the presidency.
Putcha said the model’s calculations were correct in 2016, but the polling data used was incorrect.
“If the polling is correct, the mathematical model should accurately predict the outcome of the presidential election,” Putcha said.
How Does the Engineering Math Model Work?
The math model uses engineering principles based on probability and statistics to analyze polling data from various well-known sources, which Putcha says is sufficient for prediction purposes. Putcha notes the engineering math model is more robust compared to what a political scientist would use.
The methodology captures both the popular vote, as well as the Electoral College. The model uses election polling data from various sources — such as ActiVote, Bloomberg/Morning Consult, Dartmouth College, Emerson College, the New York Times/Siena College, SurveyUSA, UC Berkeley’s Institute of Governmental Studies and the Washington Post. It calculates the probability of winning for each candidate, and assigns the corresponding electoral votes from each state for each candidate. Then, it combines the two sets of data to reach a winner.
Factors that could skew the model’s prediction are undecided voters, or voters who may refuse to participate in public polls, Putcha said.
“The main problem is when many people don’t answer phone calls to participate in the polls,” Putcha said.
To help the model achieve more precise results, Putcha said the model this year includes an “uncertainty factor” to account for voters’ gender, ethnicity, age and race.
Putcha said his team calculates a 97.4% confidence level in the polls.
About the Team
Putcha began teaching at CSUF in 1981 and retired in 2021. Over his 40-year academic career, Putcha’s interdisciplinary research has focused on engineering reliability and risk analysis. He teaches part time at Cal Poly Pomona and continues research in risk analysis.
Putcha’s research team includes CSUF alumnus and doctoral student Vineet Penumarthy ’16 (B.S. mechanical engineering) and economist Brian Sloboda.
Watch Putcha’s presentation on the model’s 2024 prediction, and access presentation slides and photos in Dropbox.