A study by a team of Cal State Fullerton student mathematicians revealed that the rate of spread of COVID-19 is significantly slower in the more prosperous counties across the United States, while the coronavirus spreads much faster in counties with lower average income.
For the first phase of the ongoing research, the students focused on 100 counties across the U.S. — the two most populous counties of each state — and collected readily accessible data to create their statistical models. The student researchers also focused on seven Southern California counties, including Orange County.

“While predicting county cases and keeping track of these cases, we saw that the case trend between the wealthiest counties was different than the rest of the counties,” said undergraduate researcher Seth Arreola.
“The counties that are wealthier did not experience the same peaks in cases as other counties and had differing rates of positive cases at different times. These results could be useful to policy decisions now and in the future in case a similar pandemic occurs in Southern California and nationally.”
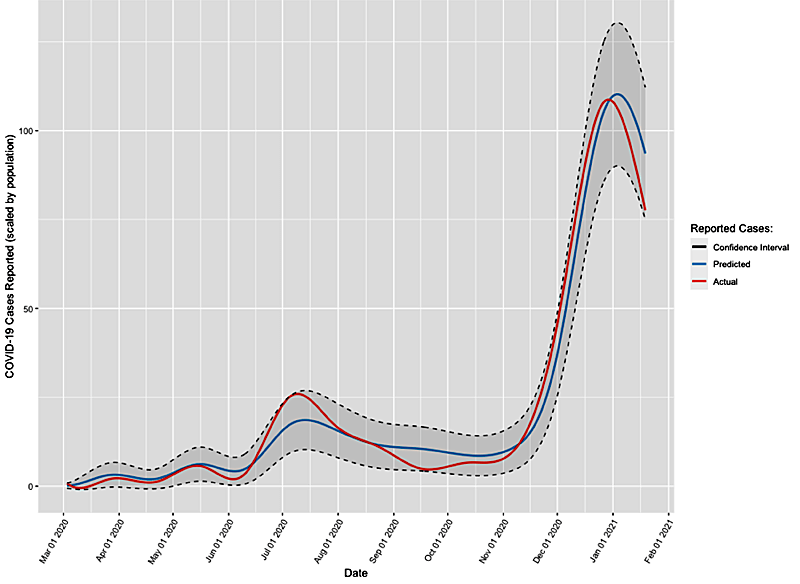
For example, their research showed that counties such Imperial County show a higher number of cases per population size than Ventura County, whose average income is significantly higher. Orange County’s coronavirus pattern is a mixture of the patterns of Imperial and Ventura likely because there is a considerable economic disparity between the cities and neighborhoods within Orange County, the researchers noted.
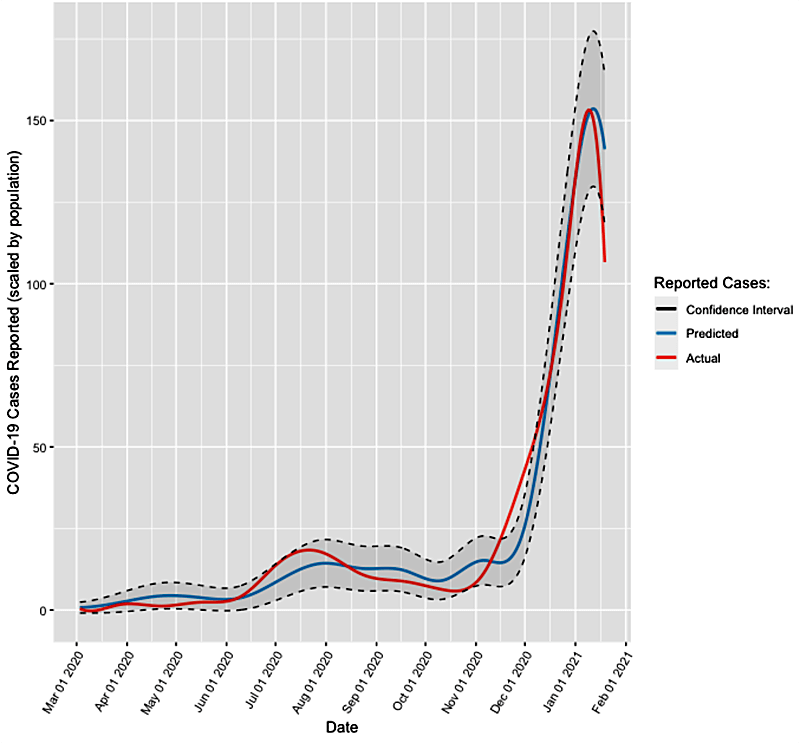
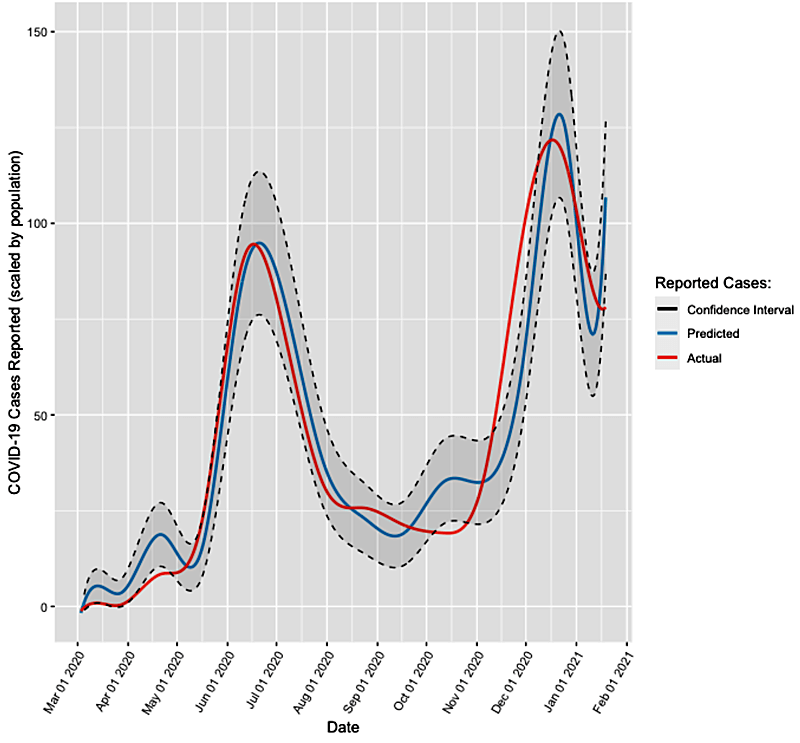
The plot shows the rate of infected cases in Ventura County (left) versus Imperial County (right). The statistical model (blue curve) accurately represents the pattern of the changes in actual data (red curve). The dotted lines are the 95% confidence bands. As shown in this figure, while Imperial County was suffering from a significant spread of the disease in the months between May-July 2020, the rate of infection at the same period remained flat in Ventura County, a more prosperous county.
The students’ research goals were to predict and track COVID-19 cases by county, and classify, or rank, the counties based on their COVID-19 infection data from USA Facts, including the number of cases and deaths, said undergraduate researcher Gwendolyn Lind. They also used mobility data — the movement trends of people over time, such as going to grocery and retail stores, or using public transportation, driving and walking — from Google and Apple data, Lind added.
Statistical models have been used in modeling pandemics for decades and as a paradigm for making sense of epidemiological data, said Sam Behseta, professor of mathematics and the students’ research adviser.
What is noteworthy in this research by Behseta’s students is they have utilized relatively straightforward techniques — using machine learning and statistical models — to understand the role that mobility and economic status of certain counties can play in the spread of COVID-19.
“The students created simple statistical methods that are quite accurate. Some of their models attain more than 90% accuracy. As such, they can be used as an informative tool for decision-making in the context of the spread of infectious diseases,” explained Behseta, director of the Center for Computational and Applied Mathematics. “When looking at mobility and socio-economic data, the statistical models can guide us with estimating the impact of how quickly the disease will spread.”
For the COVID-19 research project, mathematics students are introduced to, and apply, more advanced statistical modeling strategies that are typically taught and presented in graduate-level courses, Behseta said.
The students delved into writing elaborate computer code to read the multiple types of data from different sources, manipulated and prepared data for the analysis, and interpreted the outcomes of their models.
Behseta is planning to incorporate the data and models associated with this work to his undergraduate and graduate courses in machine learning, starting this spring semester.
In addition to Arreola and Lind, undergraduate Caleb Peña, all studying statistics and probability, and applied mathematics graduate student Cameron Abrams collaborated on the project virtually due to the pandemic.

The student mathematicians worked on the research during the fall semester as a data science project of the Center for Computational and Applied Mathematics. Their work culminated with a public presentation titled, “A Few Strategies for the Statistical Modeling of the COVID-19 Pandemic Data.” Arreola, Peña and Abrams all graduated this month.
Lind, along with another team of six other undergraduate and graduate students, will continue working on the research this spring semester. They will focus on how vaccinations could affect the rate of the virus spread, plus how new mandates, such as requiring the wearing of masks on federal properties, play a role in the control of the disease.